
DIRECT ANSWER |
|---|
To reduce CAC for a D2C brand, first verify the metric, then find the largest leak across five gates: measurement, message and traffic quality, on-site conversion, delivery success, and customer compounding. Fix the binding constraint before changing budgets. Cheaper clicks do not help if the wrong shoppers arrive, checkout fails, COD orders return, or first-time buyers never return. 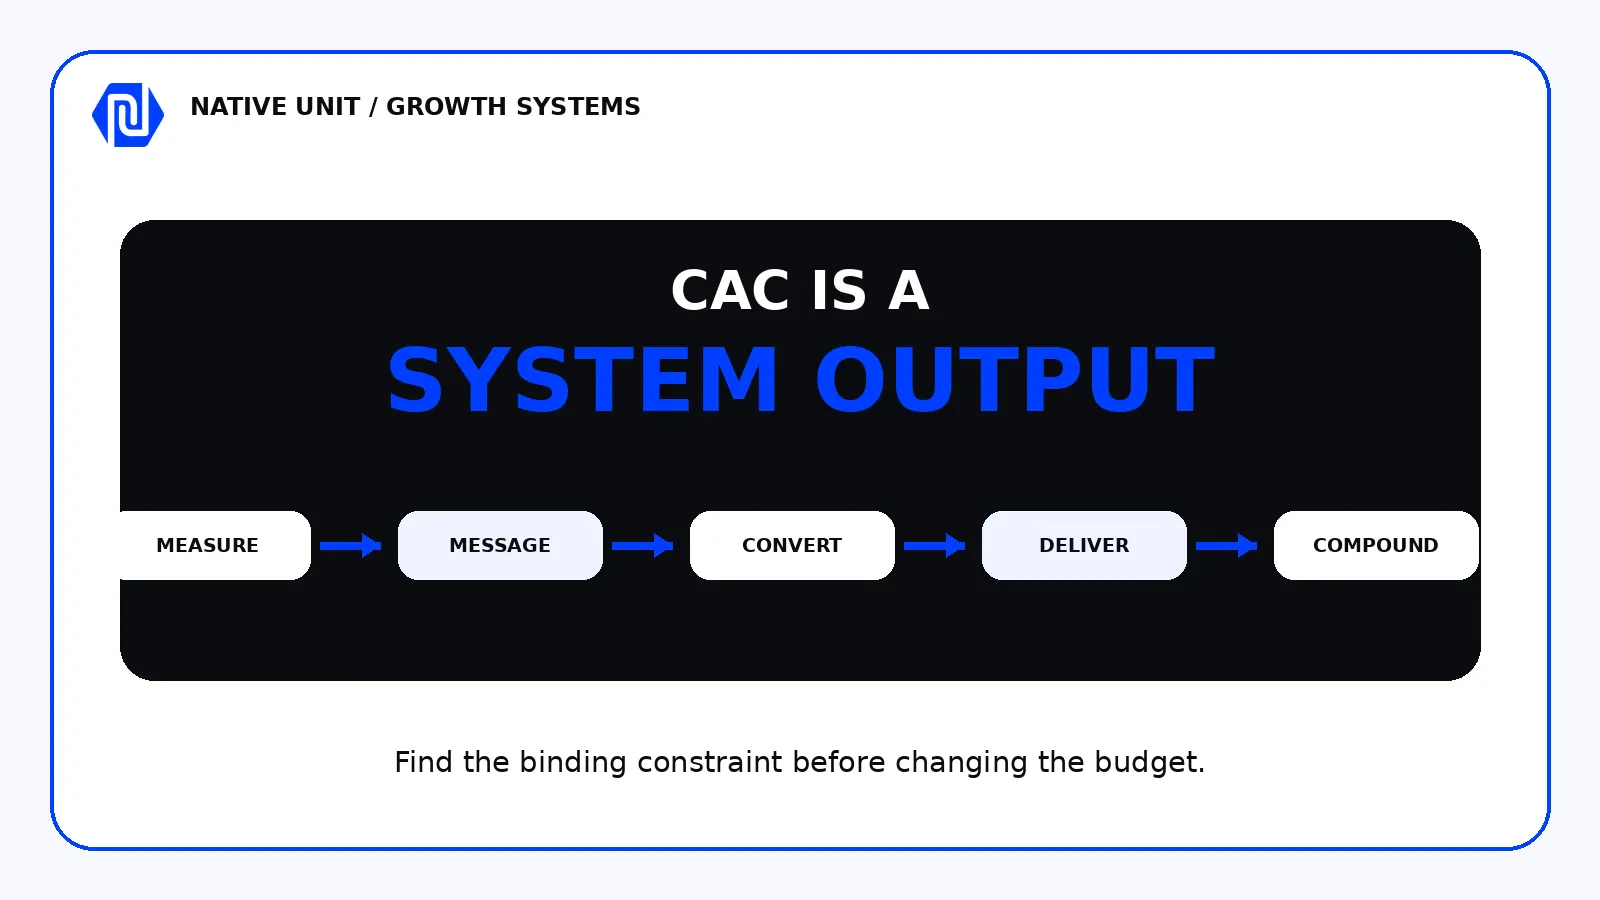 |
CAC is a system output. Diagnose the binding constraint before changing the budget.
What does CAC actually mean for a D2C brand?
Customer acquisition cost is the total sales and marketing cost used to acquire genuinely new customers during the same measurement period. The standard formula is total acquisition expense divided by new customers acquired. Shopify's current ecommerce guidance explicitly includes media, creative, agency or contractor fees, software and relevant team time, not only ad spend [1].
FORMULA |
|---|
Fully loaded CAC = Total acquisition expense / Verified first-time customers |
That definition creates an immediate operating rule: do not allow three teams to use the same word for three different numbers. Meta or Google cost per attributed purchase, finance's fully loaded CAC, and the cost per successfully delivered first order answer different questions.
Metric | Use it to answer | Do not use it to claim |
|---|---|---|
Platform CAC | Is this campaign producing attributed new-customer purchases efficiently? | What the business truly spent to acquire a customer. |
Channel CAC | Which source produced verified first-time customers at what direct cost? | Customer quality, delivery success or payback on its own. |
Fully loaded CAC | What did the business spend across media, people, creative, tools and offers per new customer? | Which exact funnel step is broken. |
Cost per delivered first order | How do COD, cancellation and RTO change the economics after purchase? | A replacement for CAC; it is an India-relevant companion metric. |
CAC payback | How quickly does contribution profit recover acquisition cost? | A universal healthy benchmark across categories. |
Google Ads supports a new_customer parameter specifically to improve new-customer reporting. It can be passed with purchase conversions as true, false or unspecified [2]. GA4 also separates User acquisition, which is scoped to new users, from Traffic acquisition, which is scoped to sessions [3]. Those are useful signals, but your order and customer system should remain the financial source of truth.
Why rising CAC is usually misdiagnosed
CAC rises when the numerator grows, the denominator shrinks, or the denominator was counted incorrectly. Paid media can cause any of those outcomes, but so can creative production cost, weaker product-page conversion, payment failures, discount leakage, COD returns, low repeat behaviour or a reporting definition that quietly includes returning customers.
Myth: CAC rose, so the media team needs cheaper traffic. |
|---|
Reality: cheaper traffic is useful only if it produces verified, delivered, commercially valuable new customers. A lower CPC with weaker intent can make fully loaded CAC worse. |
This is why Native Unit treats CAC as a system output. Acquisition, content, conversion, analytics and retention can all influence the same number. Delivery and fulfilment sit outside the six marketing engines, but they can determine whether an acquired order becomes realised revenue at all.
The CAC Constraint Map: five gates to inspect in order
The CAC Constraint Map is an original Native Unit diagnostic. Each gate asks one question and requires one class of evidence. Move to the next gate only when the earlier one is trustworthy. Otherwise, the team risks optimising noise.
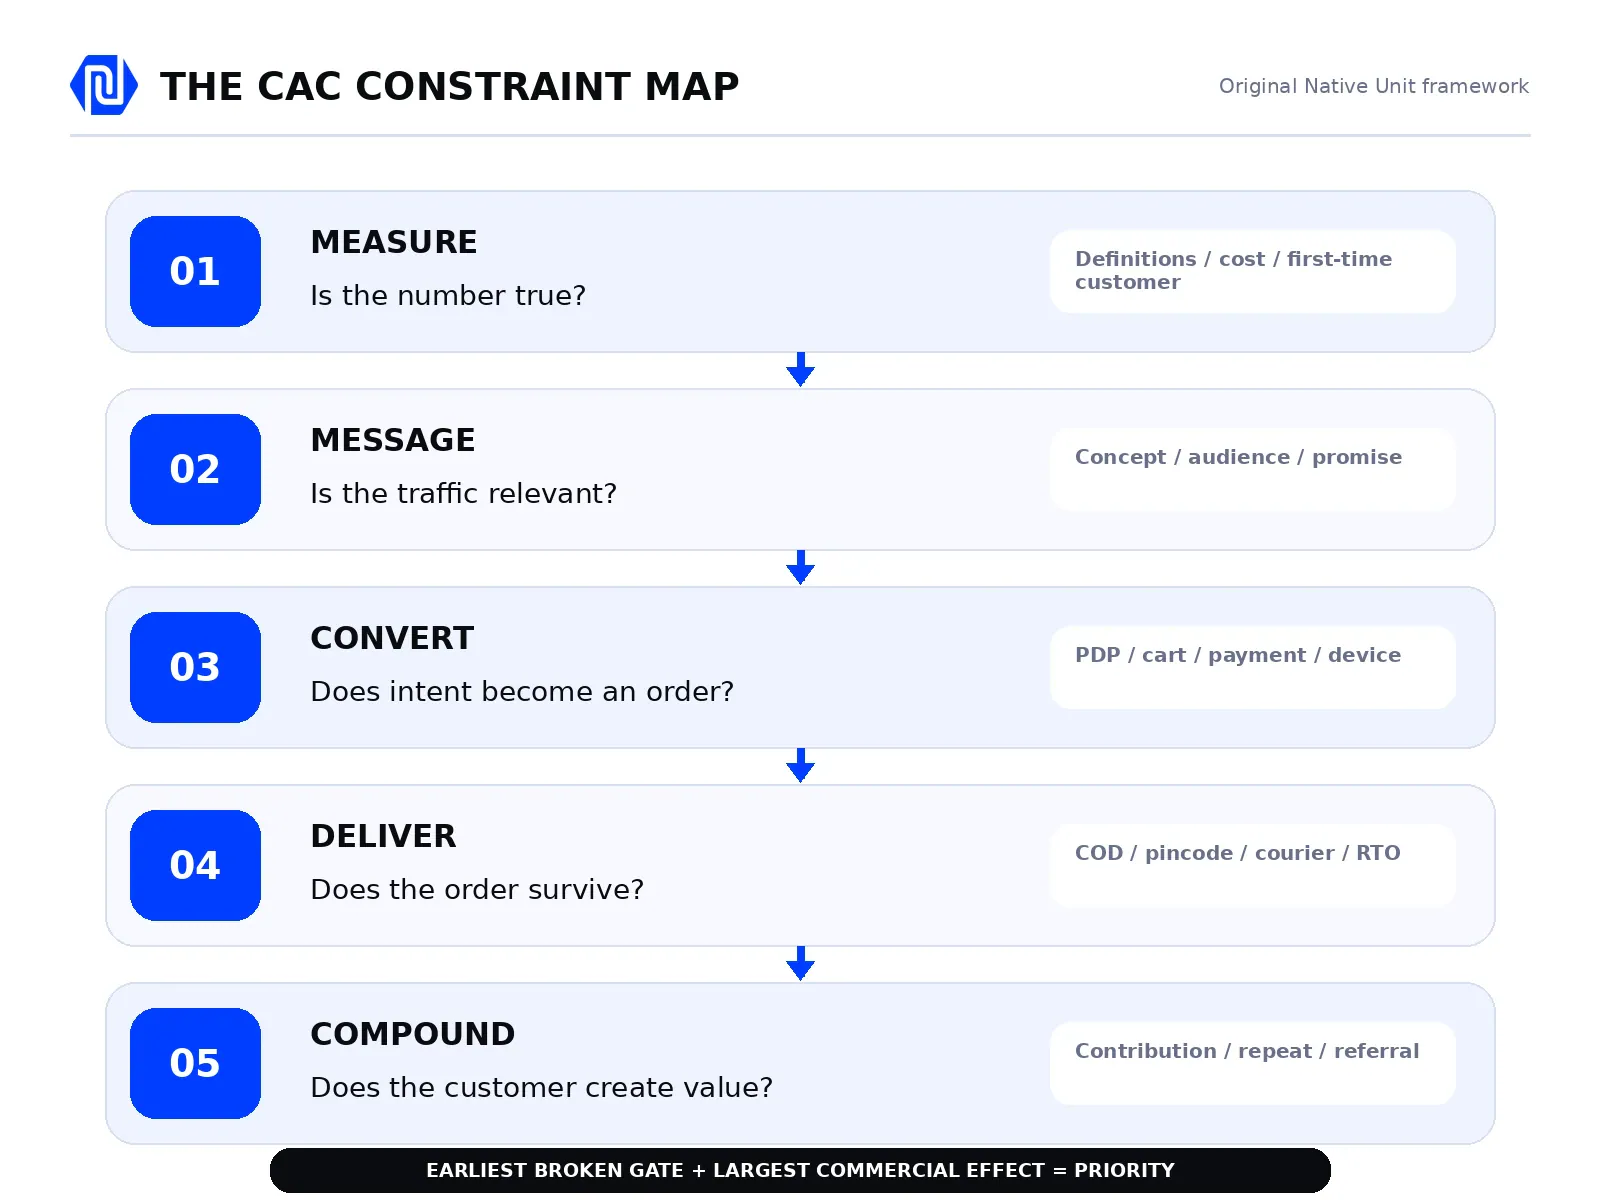
The CAC Constraint Map: verify each gate in order and prioritise the earliest commercially material break.
Gate 1: Is the number true?
Start with definitions, identity and cost coverage. Choose a fixed measurement window. Count first-time customers consistently. Include the acquisition expenses finance actually pays. Separate orders placed from orders delivered. Document how discounts, cancellations, refunds and RTO are treated.
✓ New-customer status is derived from the order or customer record, not assumed from platform attribution.
✓ Media, creative, relevant team or partner cost, tools and acquisition offers are included once, not omitted or double-counted.
✓ Platform, channel, fully loaded and delivered-customer views are labelled separately.
✓ The same date range and attribution rule are used when comparing periods.
If the metric fails this gate, the first experiment is not a campaign. It is measurement repair.
Gate 2: Are the message and traffic still relevant?
A creative can fatigue, but file age is not the only signal. The audience may have saturated, the offer may attract discount-only buyers, the hook may promise something the product page does not prove, or the campaign may be finding cheaper customers with worse delivery and repeat behaviour.
Signal | Likely question | Evidence to inspect |
|---|---|---|
CTR falls while reach continues | Has the concept lost relevance? | Angle, hook, format, audience and frequency by week. |
CTR holds but purchase rate falls | Does the landing experience break the promise? | Ad-to-page message match, device funnel and page speed. |
Platform CAC improves but delivered economics worsen | Are we acquiring lower-quality orders? | New customer, COD share, RTO, contribution and repeat by source. |
One asset wins, but no one knows why | Is learning captured at concept level? | Tag problem, promise, proof, offer and persona, not only filename. |
The fix is a concept pipeline, not a random asset quota. Launch differentiated ideas, label the strategic variables, and connect each concept to landing-page and customer-quality outcomes.
Gate 3: Does the site convert the intent you paid for?
GA4's Purchase journey report follows session start, product view, add to cart, begin checkout and purchase. It is designed to show where users drop between those steps [4]. Use it by device and traffic source, then validate with order and payment data.
Checkout research can help form hypotheses, but it must not be presented as an Indian benchmark without Indian evidence. Baymard's updated research, for example, reports that 17% of surveyed US online shoppers abandoned because checkout felt too long or complicated [5]. The operational lesson is to test friction; the percentage should not be copied into an India performance forecast.
Decision signal | What to inspect |
|---|---|
If product views drop | Check landing relevance, loading, navigation and product discovery. |
If add-to-cart drops | Check value proof, imagery, sizing or usage clarity, price framing and delivery expectations. |
If checkout starts but purchases fail | Check errors, preferred payment methods, surprise costs, trust and mobile form friction. |
If purchases rise but delivered orders do not | Move to Gate 4. Do not celebrate the purchase event in isolation. |
Gate 4: Do acquired orders survive delivery?
For Indian D2C, an order event is not the end of acquisition economics. COD confirmation, address quality, pincode, courier, delivery promise, NDR handling, product fit and customer expectation can all decide whether the order is delivered or returned.
Unicommerce's FY26 D2C report says its analysis draws on 410 million shipments across more than 6,000 brands. During the festive quarter in that dataset, COD orders returned at 58%, while prepaid orders were under 15% [6]. This is a period-specific platform finding, not a universal rate. It is strong evidence that payment mode and fulfilment deserve their own diagnostic layer.
Do not respond with a blanket COD ban. First segment RTO by pincode, courier, SKU, promised versus actual delivery time, acquisition source and creative or offer. Restricting COD may reduce bad orders and also reduce legitimate conversion. The decision requires a contribution and conversion trade-off, not a single RTO target.
Gate 5: Does the customer compound after the first order?
Retention does not retroactively lower the historical CAC you already paid. It improves LTV, contribution, payback and the amount of future revenue that does not require another first-customer purchase. Referrals and organic demand can also lower future blended acquisition dependence when they generate genuinely new customers.
Read repeat purchase by first product, first offer, acquisition source, creative concept and delivered order date. A channel with a higher first-order CAC may be the better growth channel if it brings customers who receive the product, keep it and return with stronger contribution. The reverse can also be true.
How to find the binding constraint
Do not average away the clue. Build one weekly view where the rows are acquisition sources or campaigns and the columns follow the customer: spend, verified new customers, product-page conversion, checkout completion, payment mode, delivered first orders, contribution and cohort repeat.
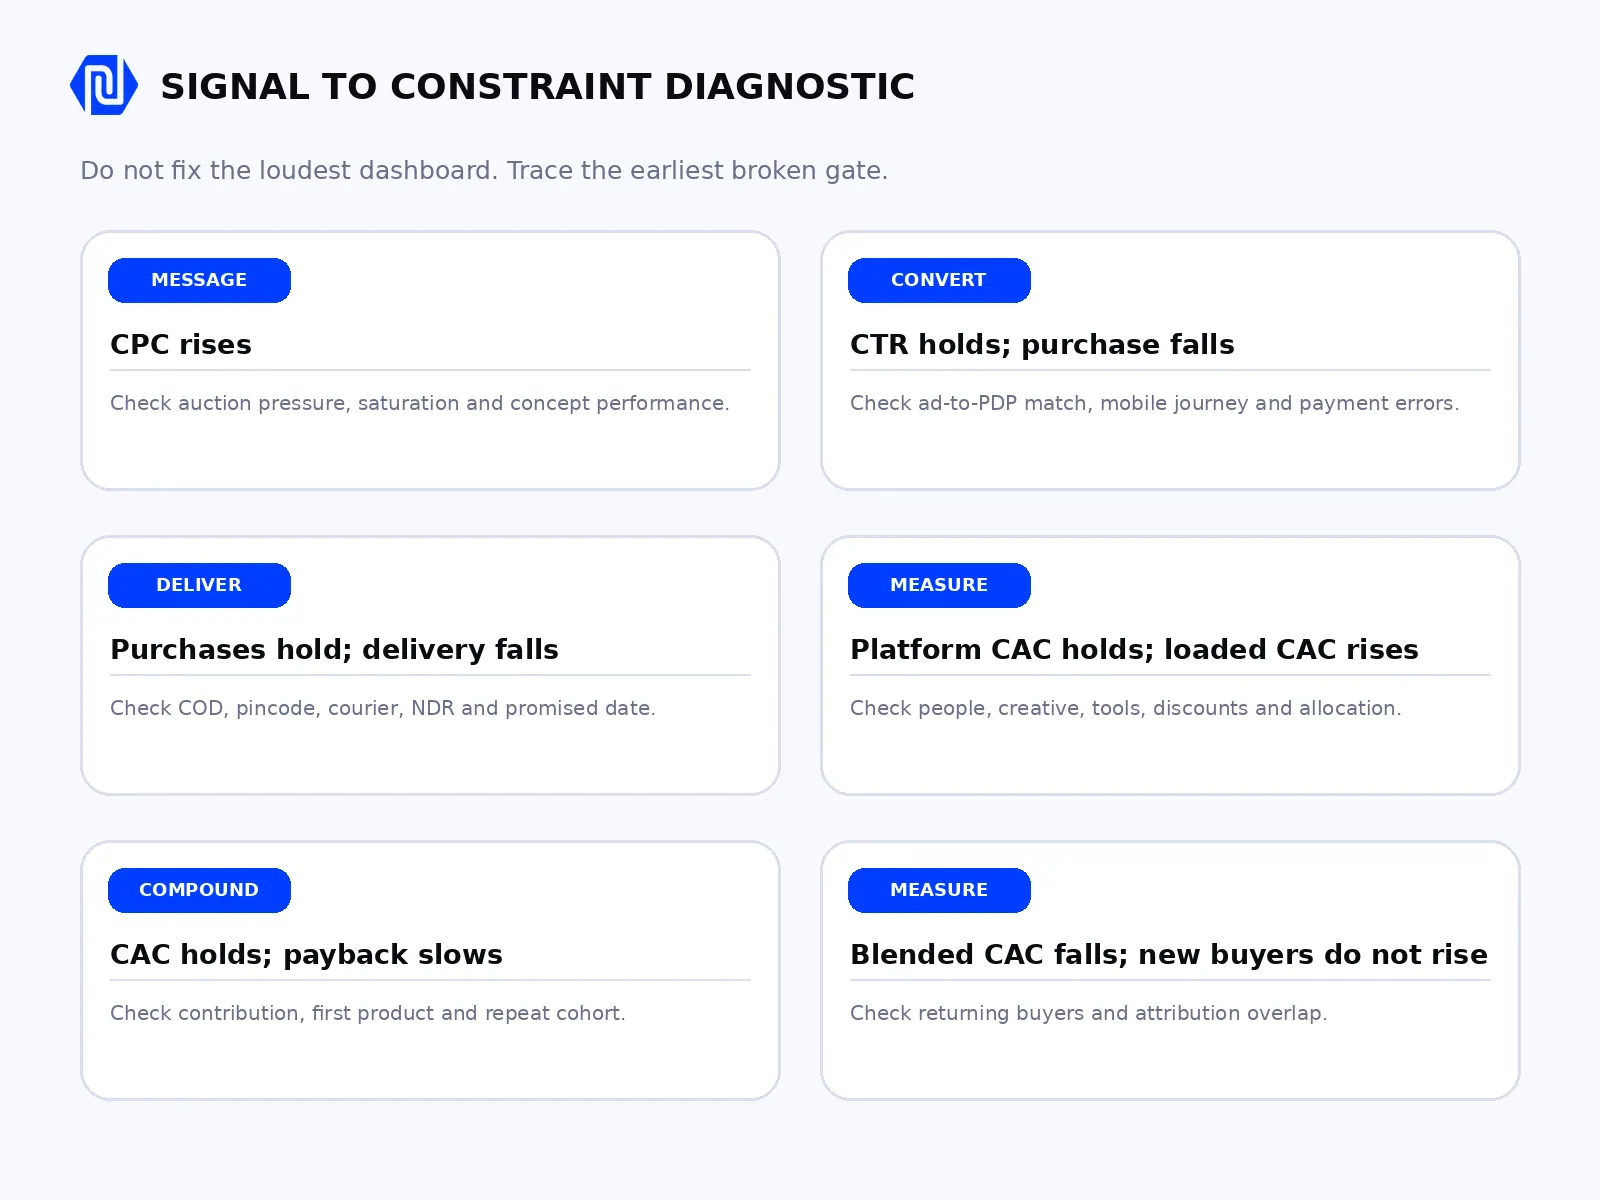
Trace the signal to the earliest plausible constraint before assigning a fix.
What changed? | Most likely gate | First check |
|---|---|---|
CPM or CPC rises; site and delivery rates hold | Message and traffic | Auction pressure, saturation, concept-level performance and channel mix. |
CTR holds; product-to-purchase rate falls | Conversion | Ad promise versus PDP proof, device journey and payment errors. |
Purchases hold; delivered first orders fall | Delivery | COD, pincode, courier, NDR, SKU and expected delivery date. |
Platform CAC holds; fully loaded CAC rises | Measurement or operating cost | Creative, team, tooling, discounts and cost allocation. |
Blended CAC improves; verified new customers stay flat | Measurement | Returning customers in the denominator or attribution overlap. |
CAC holds; payback lengthens | Compounding or margin | Contribution, first product, discount depth and repeat cohort. |
OPERATING RULE |
|---|
Decision rule: prioritise the earliest broken gate with the largest commercial effect and enough evidence to test. A later-stage improvement cannot compensate indefinitely for an earlier measurement error. |
Three illustrative Indian D2C scenarios
NOTE |
|---|
The following are illustrative operating scenarios, not Native Unit client claims or market benchmarks. |
Food and beverage: the ad is not the first suspect
CTR and website purchase rate are stable, but delivered first orders decline. RTO is concentrated in a small pincode and courier combination after a delivery-time promise changed. The first fix belongs to delivery routing and expectation clarity, not a new audience.
Skincare: the cheaper customer may be the expensive customer
One campaign produces a lower first-order CAC, but its customers buy a heavily discounted entry SKU and rarely return. Another campaign costs more upfront but brings customers with stronger delivered contribution and 90-day repeat. The scale decision should use cohort economics, not platform CAC alone.
Apparel: the creative promise exposes a product-page gap
A fit-focused creative wins the click, but mobile add-to-cart drops because the size guide is difficult to find and returns language is unclear. More fit creatives increase traffic into the same uncertainty. The constraint is conversion clarity.
A 30-day D2C CAC reset
The goal is not to redesign the whole growth stack in a month. It is to produce one trustworthy diagnosis, run one cross-engine experiment and decide what deserves scale.
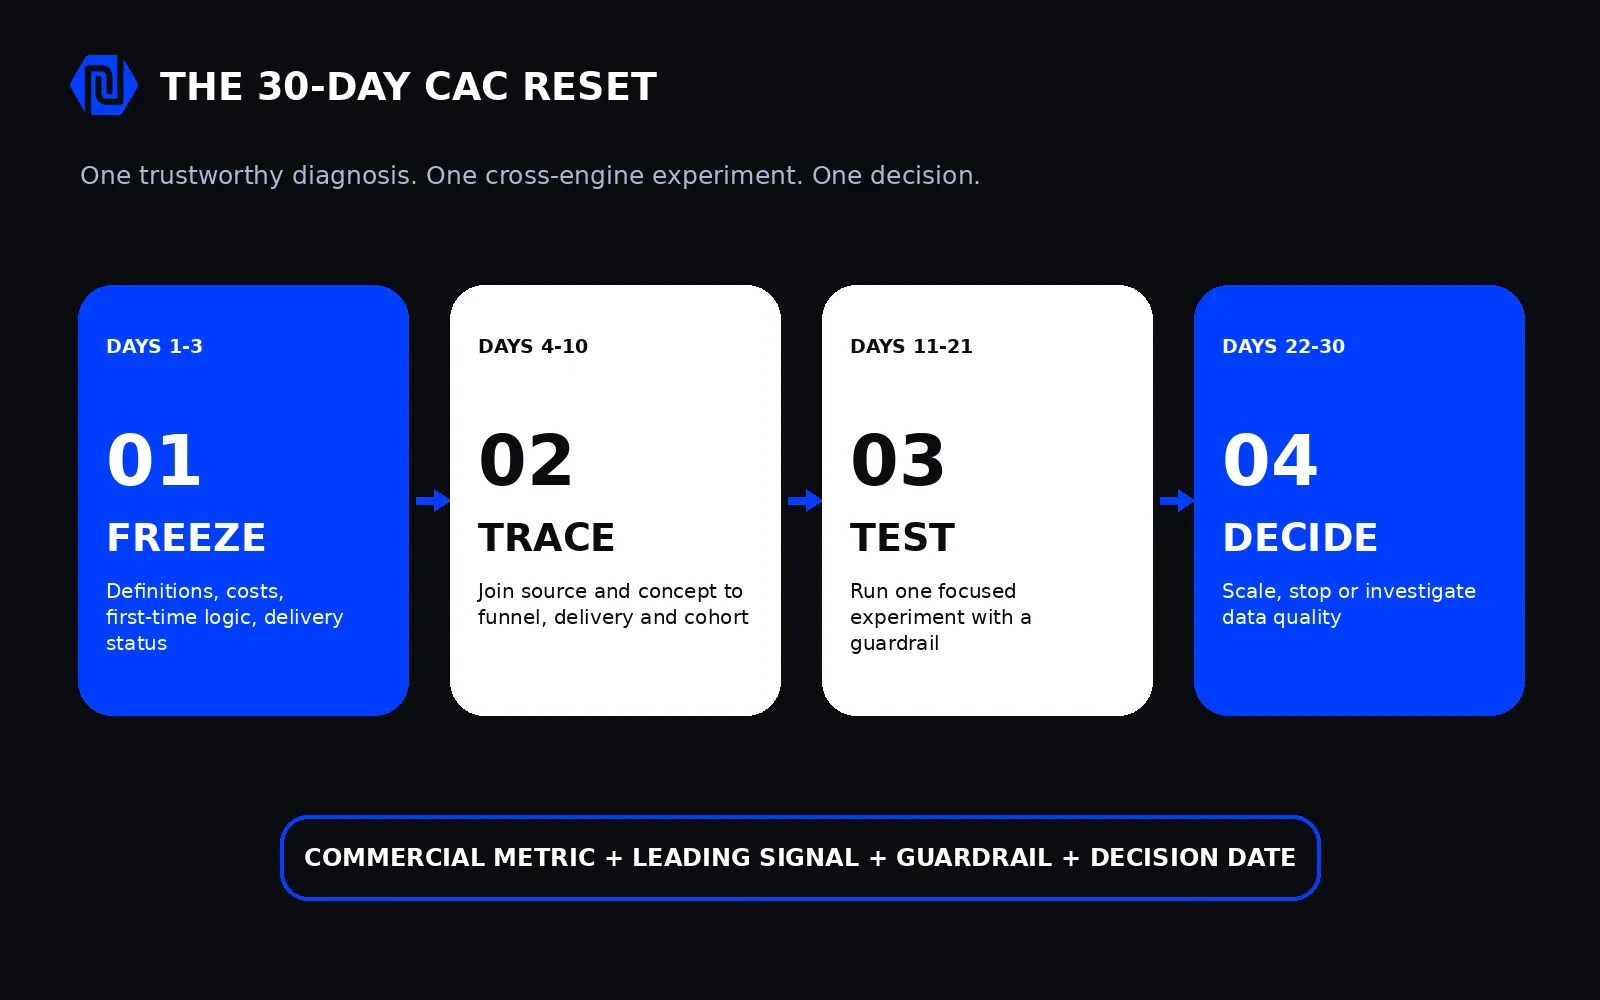
A 30-day reset should end in a decision, not another dashboard.
Step | Action |
|---|---|
01 | Days 1-3: Freeze the definitions |
02 | Days 4-10: Build the constraint view |
03 | Days 11-21: Run one focused experiment |
04 | Days 22-30: Scale, stop or investigate |
Experiment component | Example |
|---|---|
Hypothesis | Clarifying delivery date and returns on the PDP will improve first-order purchase quality from high-intent paid traffic. |
Leading indicator | PDP-to-checkout rate by device and source. |
Commercial metric | Fully loaded cost per delivered first-time order. |
Guardrail | Prepaid conversion and contribution do not deteriorate. |
Decision date | Set before launch; do not extend because the result is uncomfortable. |
Who this framework is for
Use it when | Reconsider or simplify when |
|---|
The trade-offs most CAC advice hides
Action | Possible gain | Possible cost |
|---|---|---|
Cut broad prospecting | Lower short-term platform CAC | Less new demand and greater dependence on retargeting. |
Increase discounts | Higher first-order conversion | Lower contribution, weaker customer quality and trained discount behaviour. |
Restrict COD | Lower exposure to some RTO | Lost legitimate orders and lower conversion in COD-reliant segments. |
Scale the cheapest channel | More first orders for the same direct spend | Potentially weaker delivery, margin or repeat cohorts. |
Publish more creatives | More chances to find a winner | Higher fully loaded CAC if learning is not captured and reused. |
A growth system is valuable because it keeps those trade-offs visible. It prevents one team from improving its dashboard by moving cost into another part of the business.
Your CAC is the symptom. Find the constraint. |
|---|
Native Unit's existing 10-minute audit maps where growth is leaking across acquisition, conversion, retention, content, organic and analytics, then frames a 90-day reset with board-ready KPIs. |
Zero-cost diagnosis. Bring your current CAC, conversion and repeat-purchase view if available. Your data stays private. No spam. |
Conclusion
The useful question is not 'How do we make media cheaper?' It is 'Which customer became expensive, at which gate, and what evidence proves it?' Once the team can answer that, CAC stops being a monthly panic number and becomes a map for the next operating decision.
Sources
1. Ecommerce Customer Acquisition: Channels and Formula
Shopify India. 1 July 2026. Accessed 11 August 2026. Supports: CAC definition, formula, and costs that should be included.
2. Set up new customer acquisition parameter in your conversion tracking tag
Google Ads Help. Undated live documentation. Accessed 11 August 2026. Supports: Use of the new_customer parameter and first-time-customer reporting.
3. User acquisition report vs. Traffic acquisition report
Google Analytics Help. Undated live documentation. Accessed 11 August 2026. Supports: Difference between new-user scope and session scope in GA4.
4. Purchase journey report
Google Analytics Help. Undated live documentation. Accessed 11 August 2026. Supports: Funnel steps and drop-off analysis from session start to purchase.
5. 50 Cart Abandonment Rate Statistics 2026
Baymard Institute. 22 September 2025. Accessed 11 August 2026. Supports: Checkout complexity as a documented abandonment cause; US evidence is treated as directional, not an Indian benchmark.
6. The New D2C Playbook: Why Operations Beat Marketing
Unicommerce. April 2026; exact day not shown. Accessed 11 August 2026. Supports: India-specific shipment data and the festive-quarter COD versus prepaid RTO finding.
Frequently Asked Questions
CAC is the total acquisition expense in a defined period divided by verified first-time customers acquired in that period. A finance view should include media, creative, relevant team or partner cost, tools and acquisition offers. Platform cost per purchase is useful, but it is not the fully loaded business CAC.